Here
the coupled vibrations of the composite wing configurations are
considered. First, a uniform glass/epoxy wing beam model is analyzed.
The second example represents a stepped piece-wise uniform cantilever
composite beam. The natural frequencies and modes of vibration are
studied. The DFE results are compared with those obtained from DSM and
FEM approaches.
4.5.1 Free vibration of a uniform beam
Effective bending rigidity, EI = 0.2865 Nm2;
Torsion rigidity, GJ = 0.1891 Nm2;
Bending-torsion coupling rigidity, K = 0.1143 Nm2;
Mass
per unit length, m = 0.0544 kg/m;
Mass
moment of inertia per unit length, Ia, =
7.77 x 10⁻⁷ kg.m
Length of the beam, L = 0.1905 m.
Table
4‑1: Material Properties of a glass/epoxy
Laminate
|
EL |
9.71 GPa |
|
ET |
3.25 GPa |
|
GLT |
0.9025 GPa |
|
nLT |
0.29 |
|
Thickness |
3.18 mm |
The variations of bending rigidity, EI, torsion rigidity, GJ,
and bending-torsion coupled stiffness, K, as functions of
different ply angles displayed in Figure 4‑9.
This plot is particularly important for optimization since a wing
composed of fibre-reinforced composite material can be designed for any
desired stiffness and corresponding frequency response. A greater
flexibility is available with composites which is not necessarily
restricted to the plot shown in Figure 4‑9: Plot of Rigidities vs Ply
angle for a glass/epoxy composite.Different
stacking sequences and ply thickness lead to a much greater domain of
possible stiffness properties. Different stacking configurations will be
considered in Chapter 5.
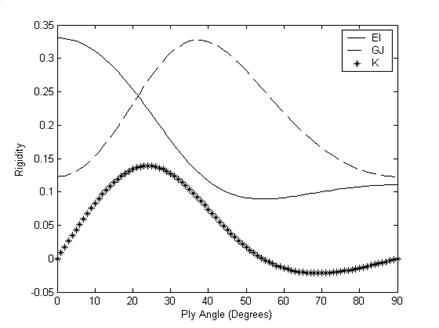
Figure 4‑9: Plot of
Rigidities vs Ply angle for a glass/epoxy composite.
The convergence results for the 1st four natural frequencies
of a uniform glass/epoxy composite beam are presented in Figure 4-10 and
the corresponding modes are found in the following Figure 4-10. It
is observed that the DFE and the FEM converge nearly at the same rate
for the first three natural frequencies. The DFE converges faster than
the FEM for the fourth natural frequency (refer to Figure 4-10). This
higher convergence rate can be attributed to the mode behaviour at this
natural frequency. The fourth natural frequency is predominately torsion
(refer to Figure 4-11 (d)). It has been observed that torsion plays a
more important role at higher frequencies and the DFE converges
significantly faster than the FEM as the frequency number is increased
(Borneman and Hashemi, 2003).
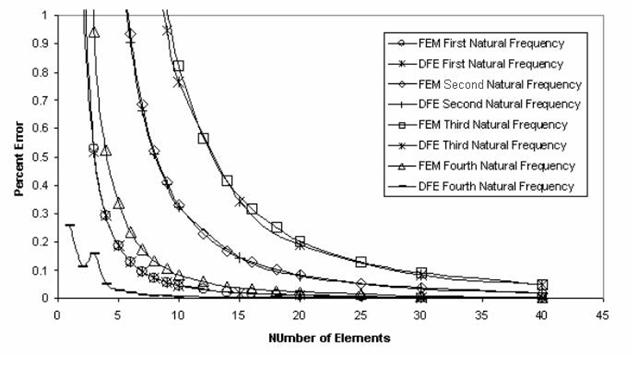
Figure
4‑10: Convergence of DFE and FEM for the first four
natural frequencies of a uniform composite wing. Percent Error is
relative to the exact values obtained from the DSM (Banerjee and
Williams, 1995).
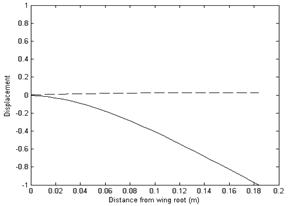
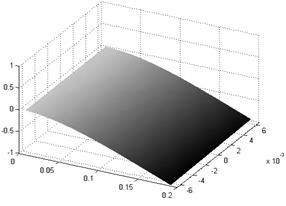
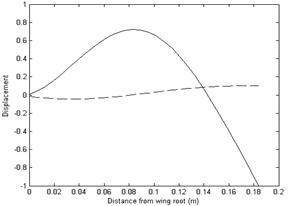
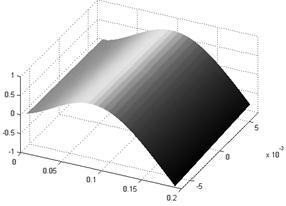
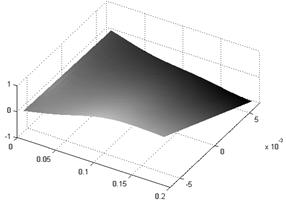
The two and three dimensional modes of deformation are also plotted in
4-11 (a)-(d) to give a visual representation of the behaviour of the
wing when vibrating at the first four natural frequencies. All modes
both 2D and 3-D have been normalized to properly distinguish the modes
as bending, torsion or bending-torsion. Numerical values of the first
five natural frequencies using various methods are presented in Table
4-2.
(a)
(b)
(c)
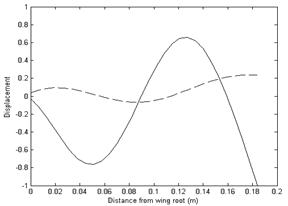
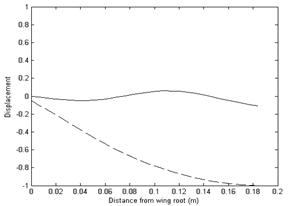
Figure
4‑11: Natural modes of free vibration for a coupled
bending-torsion uniform composite beam. (a) First Natural mode; (b) 2nd
Natural mode; (c) 3rd Natural mode;. Each 2D mode
displacement due to torsion is represented by a dashed (--) line and
bending is represented by a solid (-) line.
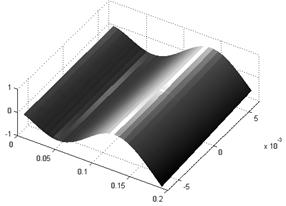
(d)
Figure
4‑12: Natural modes of free vibration for a coupled
bending-torsion uniform composite beam. (d) 4th Natural mode.
Each 2D mode displacement due to torsion is represented by a dashed (--)
line and bending is represented by a solid (-) line.
Table
4‑2: Numerical values of the first five natural frequencies (Hz)
using various methods are presented. ‘B’ denotes a predominant bending
mode and ‘T’ denotes a predominant torsion mode.
|
Natural Frequencies of a Uniform Composite Beam 15° lay-up (Hz) |
|
Natural Frequency |
FEM
20 Using Elements |
DFE
Using 20 Elements |
DSM 1
Element (Exact) |
|
1st |
30.82 |
30.82 B |
30.82 |
|
2nd |
192.87 |
192.87 B |
192.72 |
|
3rd |
538.47 |
538.42 B |
537.38 |
|
4th |
648.87 |
648.74 T |
648.73 |
|
5th |
1053.87 |
1053.46 B |
1049.73 |
The exact results for the DSM are confirmed by the earlier works
published by Banerjee (1998), Banerjee and Williams (1996), Banerjee and
Williams (1995) for the first four natural frequencies.
Figures 4-12 to 4-16 display the variations of
natural frequencies for a uniform beam over a range of ply angles. These
figures are particularily useful for a quick reference of the ply angle
for a desired frequency response. The uniform beam is composed of
glass/epoxy composite material with the same dimensions as the first
uniform model described in section 4.5.
Figure 4‑13:
Variations in the first natural frequency for different ply orientations
From Figure 4‑13
it is observed that the first natural frequency starts at its highest
point at zero degrees. The natural frequency then decreases and levels
out to a constant value at approximately 50 degrees. Similar trends in
the second natural frequency are observed where the natural frequency
levels at approximately 45 degrees ply orientation in Figure 4‑14.
Figure 4‑14:
Variations in the second natural frequency for different ply
orientations
The third natural frequency (Figure 4‑15)
again levels at nearly 50 degrees much like the first mode but an
additional increase exists at the initial range from 0-12 degrees. The
differences associated with variations in frequency can be attributed to
the stronger influence of torsion on the higher modes of materially
coupled vibration. This is observed especially in the fourth mode of
vibration (Figure 4‑16).
The fourth mode displays predominance in torsion (refer to the mode
shape from Figure 4-11 (d)). Figure 4‑16
deviates from the original trends found in the first two modes with
greater fluctuations in frequency with different ply lay-ups

Figure 4‑15:
Variations in the third natural frequency for different ply orientations
Figure STYLEREF 1 \s
4‑ SEQ Figure \* ARABIC \s 1 16: Variations in the fourth natural
frequency for different ply orientations
Figure 4‑17:
Variations in the fifth natural frequency for different ply orientations
The fifth natural frequency in Figure 4‑17
returns to the original trend found in the first two predominantly
bending modes of vibration (refer to Table 4-2). By extending the
results to the fifth mode a correlation is observed between the
influence of torsion and the fluctuations in frequency with ply
orientation.
4.5.2 Numerical example
for a step beam
More
complex geometries such as tapered wings are usually constructed using
piecewise uniform steps. The convergence results for a step beam
constructed with three steps can be found in Figure 4-17 and Figure
4-18. The beam rigidities at its root ( )
are identical to those of the previous uniform composite beam example
and each step has the length of L/3. The second and third steps
have the rigidity parameters equal to two-thirds and one-third of those
for the root, respectively.
)
are identical to those of the previous uniform composite beam example
and each step has the length of L/3. The second and third steps
have the rigidity parameters equal to two-thirds and one-third of those
for the root, respectively.
Figure 4‑18:
Convergence for a step beam formed from three steps using the FEM and
DFE for the first 4 natural frequencies. ‘NF’ represents Natural
Frequency.
Figure
4‑19: Convergence for a step beam formed from three
steps using the FEM and DFE for the 5th, 6th,
7th natural frequencies.
The percent error in Figures 4‑17 and 4-18 is calculated based on the
exact values obtained using the DSM method. The first three natural
frequencies converged at nearly the same rate as the FEM (see also
Borneman and Hashemi, 2003). It is observed from Figures 4-17 and 4‑18
that the DFE converges quicker than the FEM for higher frequencies. If a
tapered formulation was used it would include the addition of deviator
terms to compensate for the constant parameters assumed over each
element. That would increase the convergence rates, and is the factor
which distinguishes DFE from DSM method.
The DFE displays significantly better convergence than the FEM for
higher modes in the cases of the uniform and stepped composite beam. The
modes of materially coupled vibration have been classified based on
predominance of either bending or torsion and correlations have been
drawn based on the higher influence of twist on particular frequencies.
Given the fact that the DFE approach is based on a general FEM type
formulation the method can be easily extended to more complex element
geometries such as tapered elements which will be covered in Chapter 5.
